 Comply365 Vistair SafetyNet 02 / 04
 Can I file this before my handover?
Turning a rigid safety-reporting form into a faster, crew-centred reporting experience.
 — view full size
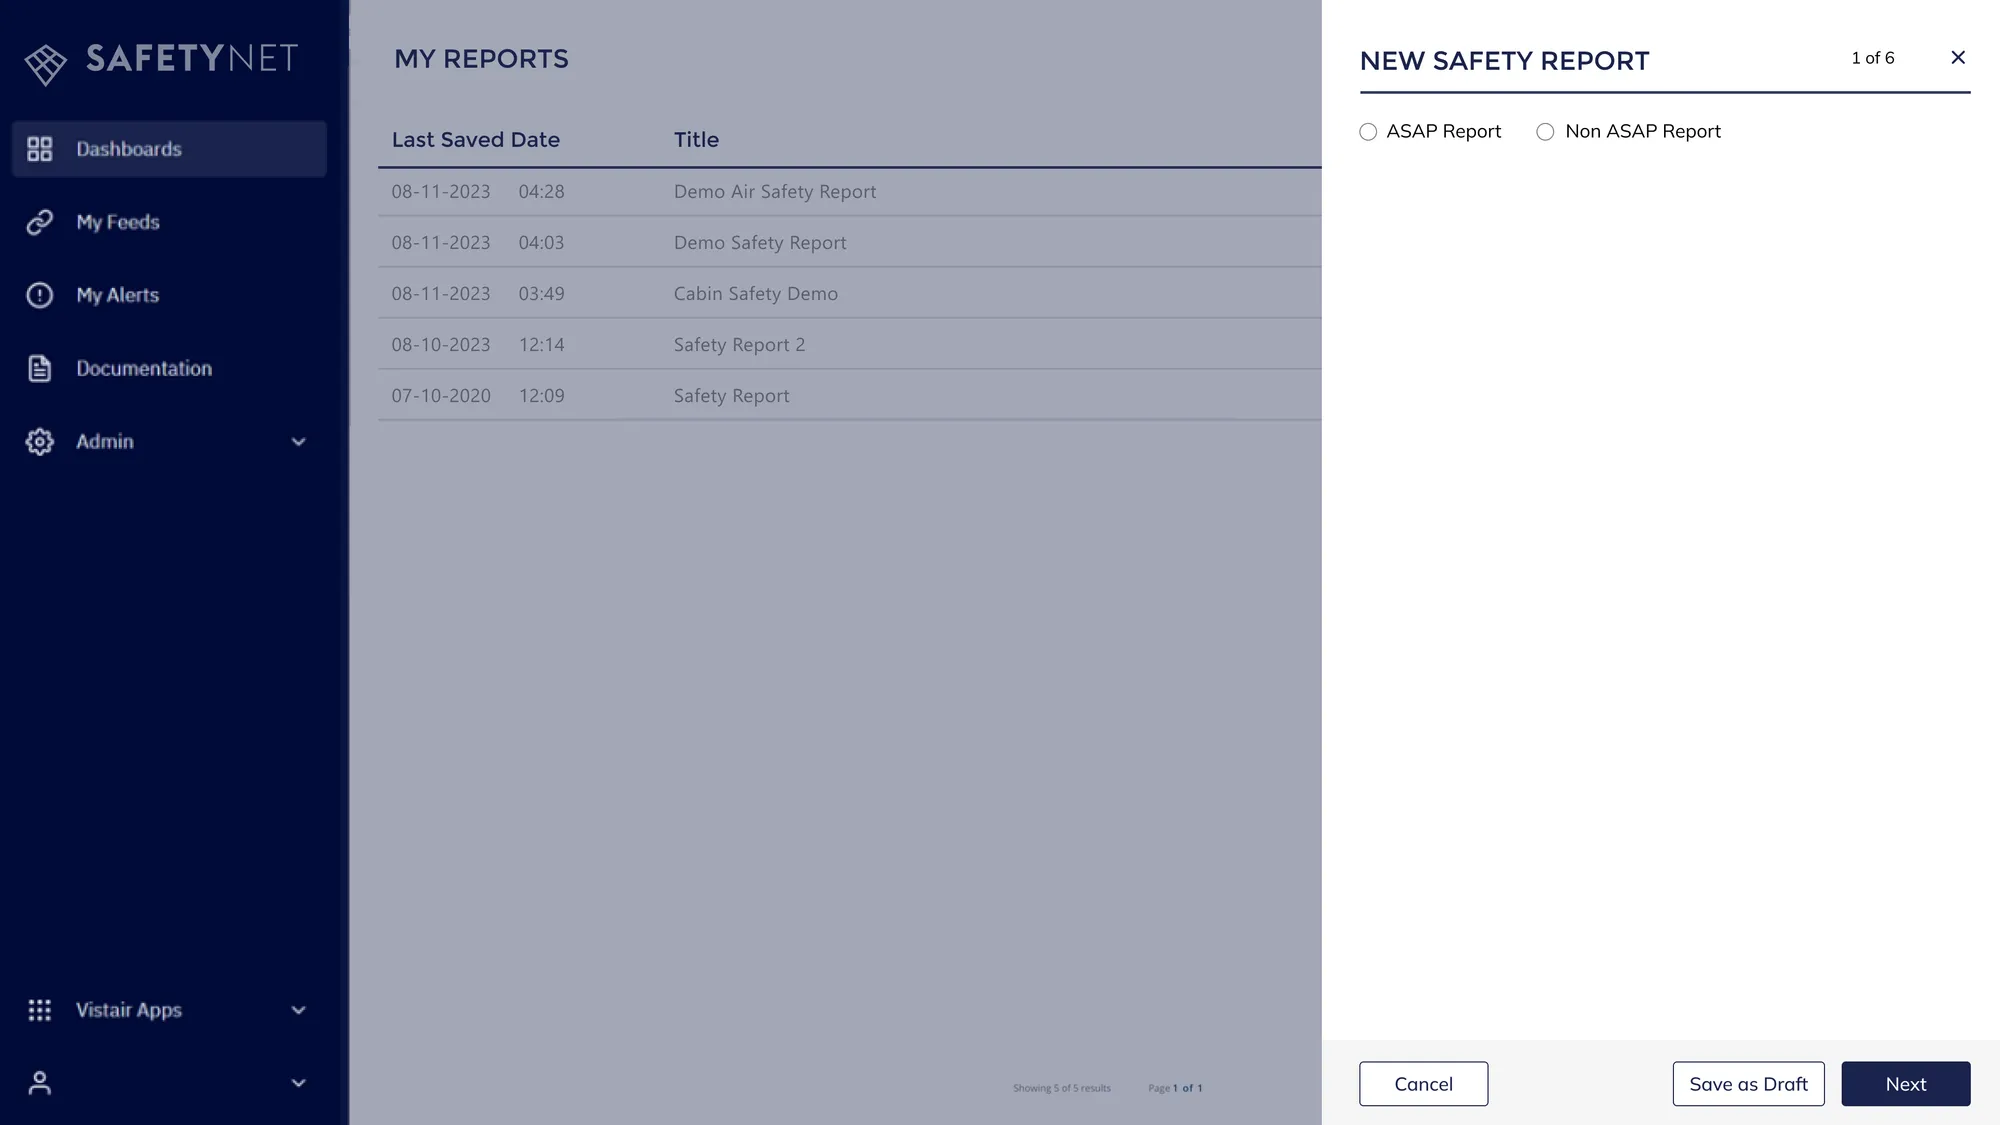
 My Reports is still there behind the drawer. Nothing the reporter was reading gets replaced to file a report.
The first question is what kind of report this is. That answer decides which of the six steps run and which fields arrive pre-filled.
One of six, stated up front. Position is announced as well as shown, so a screen-reader user knows how much is left.
A half-written report survives a boarding call. It sits in Drafts rather than being lost or filed incomplete.
Hover the markers to learn about the safety report side drawer.
The old form was built to satisfy regulation rather than the exhausted crew member filling it in mid-shift.
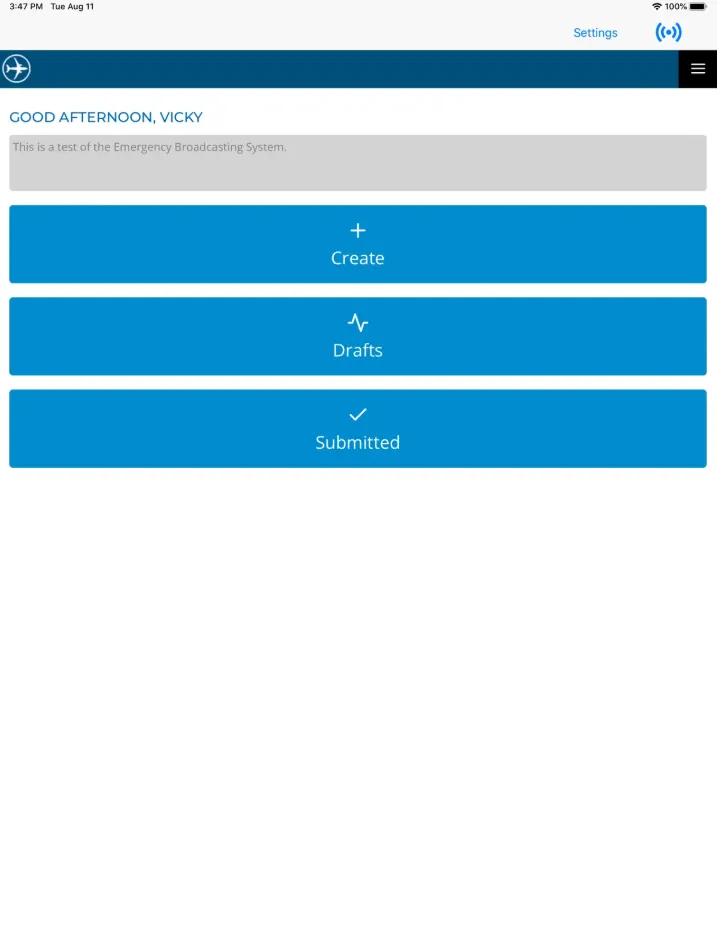
Occurrence reporting is a legal obligation. Mandatory and voluntary reports feed national regulators and schemes like ECCAIRS, and the form had been shaped around required information for auditing and regulators. The personnel filling it in has a few minutes before take-off.
This is what they were handed - a multi-step form with multiple stages, descriptions to fill in, and a single 'Today' button to populate the date. For staff under pressure this became tedious and inefficient to complete accurately.
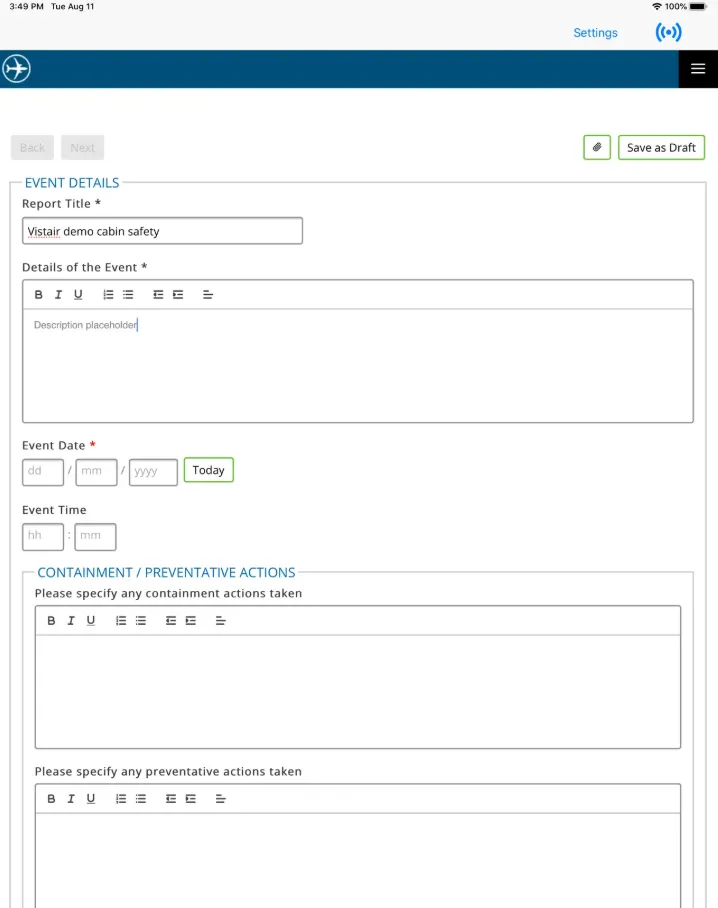
Hidden Finish Line
Depending on the device, the report opened as a full page while lacking visibility of progress and step indicators.
Static Form Fatigue
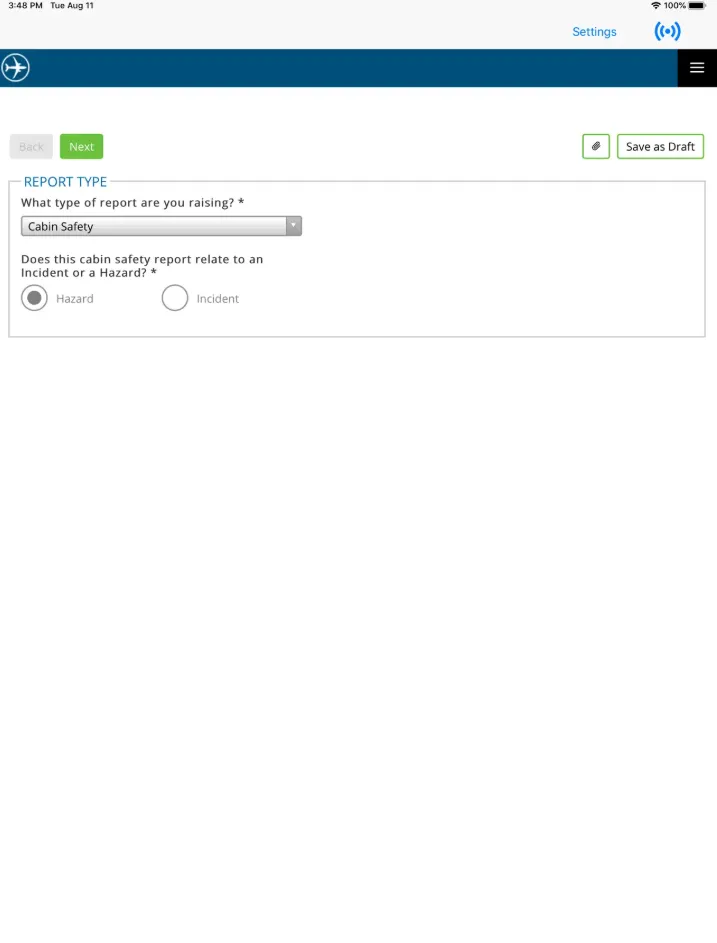
Near enough the same form for every report type. A cabin defect and a bird strike were asked the same questions, most of them irrelevant to one of the two.
Manual Entry
System details such as reporter details, departure date and time were not auto-filled. Opportunities to eliminate repetitive task were untapped.
“A report filled out incorrectly transforms a known risk into an invisible hazard that no one can see or track.”
The Stakes Behind The Form
SafetyNet is not a marginal tool. It is the safety-reporting backbone at
carriers running thousands of flights a week.
Every minute of friction results in a report that is rushed, completed late,
or never filed. A safety management system can only act on events reported.
The numbers below demonstrate the volume of safety reports being filed via
the form.
From Static Reporting To An Adaptive Form
Four real screens — three legacy, one of the redesign as it shipped — then the two behaviours the redesign turned on. Step through it with the control, the arrows, or the left and right keys.
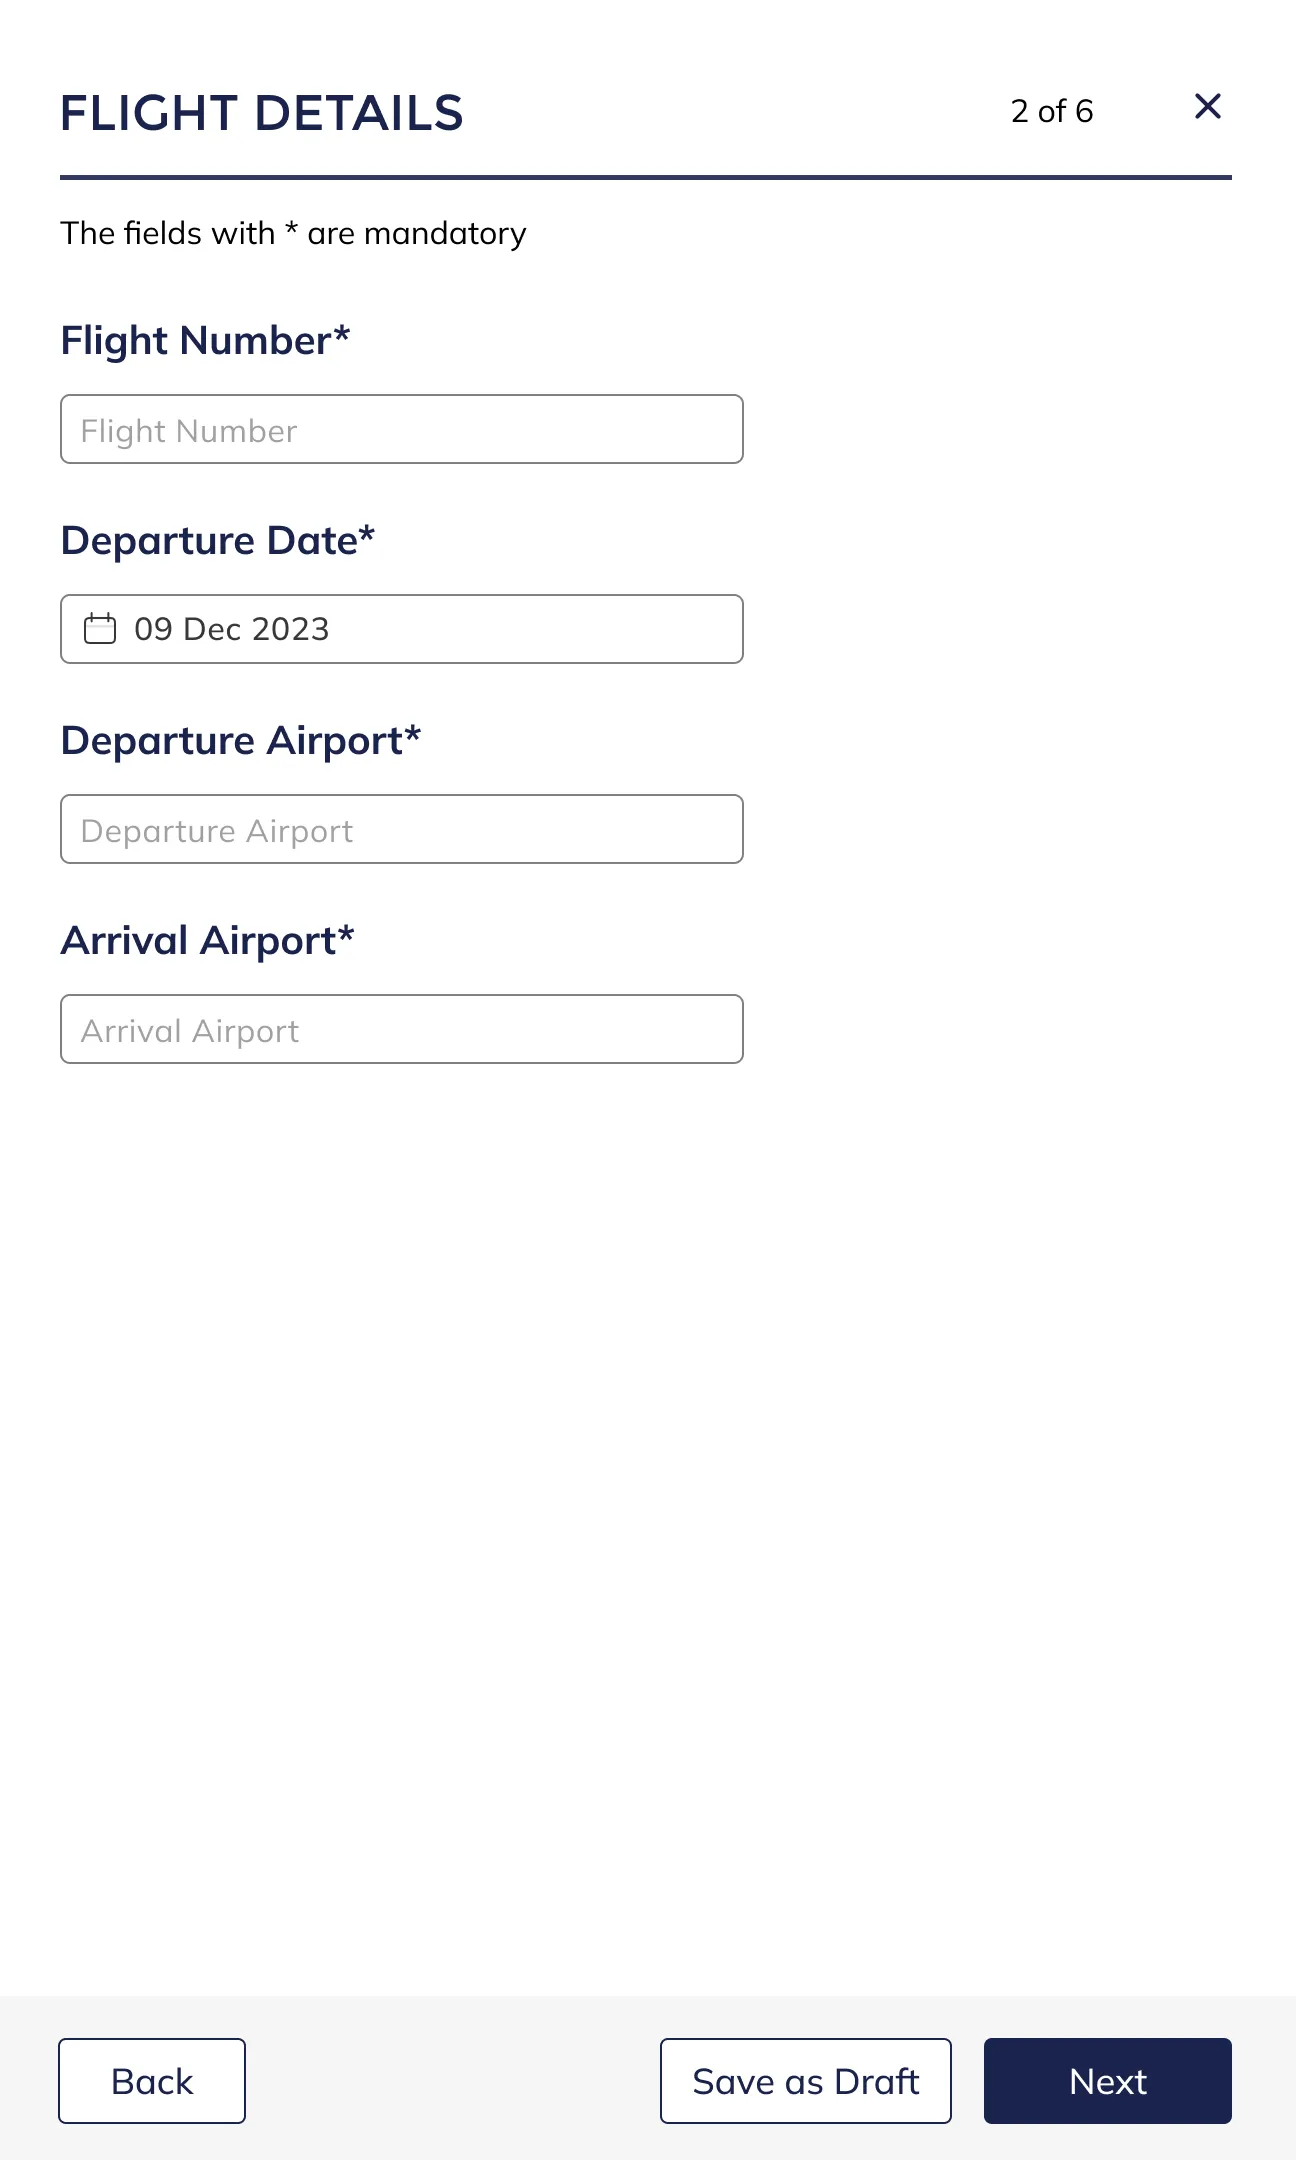
The drawer panel as shipped, cropped from the tablet screen — the dashboard it sits over is in the screenshot at the top of this page. Three things in it that were not in the legacy flow:
- 01
Position stated up front. 2 of 6, so the reporter knows what they have taken on before they start typing.
- 02
09 Dec 2023 already in the departure date. The legacy page started that field empty with a Today button to press.
- 03
Four fields on this step, not a page of them. It only runs for report types where flight details apply.
Illustrative recreation: the New Safety Report drawer open over the SafetyNet dashboard, with a step counter reading 2 of 6, a type of report set to Cabin safety, and a choice between Hazard and Incident.
Illustrative recreation: the same drawer with keyboard focus moving field to field, and a validation error shown in a live region reading “Enter a valid airport code”.
Improvement Without A Design Overhaul
As one of the front-end developers, I brought my UX/UI experience to improving a safety-critical reporting form across desktop and tablet. The goal was to reduce friction without changing the trusted reporting model, validation rules, or existing integrations.
- Scope safely. I worked with the team to identify what could change: interaction patterns, form layout, guidance, and recovery options. The underlying data, compliance requirements, and established behaviour stayed intact.
- Test and release in parallel. We checked critical desktop and tablet flows throughout delivery — including keyboard navigation, error recovery, drafts, pre-populated details, and moving backwards through the form — then released changes in small, testable increments.
Improve Reusable Patterns
Reuse trusted components where possible, then make focused improvements: clear steps, relevant fields, autofill, accessible focus states, and plain-language validation.
Design For Recovery
Give staff clear progress, a Back button, and Save as Draft so an earlier mistake or interruption does not derail a report.
Reduce Entry, Not Detail
Pre-populate known information and show only relevant fields, cutting repetitive work while preserving the detail needed for safety reporting.
Accessibility & Clear States
Crew members can navigate every field using standard keyboard commands, supported by highly visible focus indicators. Input fields feature high-contrast text, clear system states, and real-time validation. Errors are never communicated through color alone; they are always paired with distinctive warning icons and plain-language instructions to ensure reliable, stress-free filing during incidents.
Press Tab to move through the controls in order — or hover a numbered stop. Each control highlights the decision it supports.
Fields marked * are mandatory
- Tab 2
Pre-Populated Details Save Time
Pre-populated details reduce the time needed to complete a report and help ensure accuracy when the same information would otherwise be entered repeatedly.
- Tab 3
Errors Are Described
Validation errors go through a live region and are tied to the field that caused them. Never colour alone, and never only at submit.
- Tab 4
Placeholders Set Expectations
A short prompt in the text area makes the expected response clear before someone starts typing, so staff can give the detail a safety report needs without second-guessing what to include.
- Tab 5
Progress Keeps Options Open
At every step, staff can continue, save a report to complete later, or go back to correct an earlier answer. A mistake in the previous step does not trap or penalise them.
What The Teams Reported Back
Our launch strategy prioritised immediate operational safety and core user needs above all else. By analysing real-time feedback from frontline airline crew and the auditing team, we focused our initial launch metrics on reporting quality, time reduction, and causing as little disruption for users as possible.
Reported signals came from post-launch Product Owner and auditing-team feedback — from the people who review the submissions. Others are labelled as projected to guide further optimisation after launch.
Open to submitted
The post-launch completion-time signal, based on timestamps between opening a report and submitting it.
Audit-ready reports
Auditing feedback indicated more reports arrived complete and accurately filled in at the first review.
Reports returned for clarification
The auditing team reported fewer submissions being returned for missing or unclear information.
Duplicates per occurrence
Auditing feedback indicated fewer duplicate and half-finished reports reached review.
Draft abandonment
Track how many part-written reports never come back, and which step they stop at. That step is the next thing to fix.
Completion by device and report type
Compare desktop and tablet, then compare report types, to find where the adaptive flow still creates friction.